
One of our clients favorite tools is our “Side-by-Side Analysis” which allows you to compare two funds or two portfolios. We received feedback that advisors would like to be able to compare more than two funds side-by-side. This week we launched the “Fund Compare” tool which allows you to compare multiple tickers across dozens of metrics. Think of this as the security overview page for multiple tickers at once.
The objective of this feature is to help advisors and portfolio managers choose the best option for their client’s portfolio across a group of securities.
How to do this?
- If you are not a Logicly user, sign up here app.logicly.finance/signup
- If you are a Logicly user, follow the steps below.
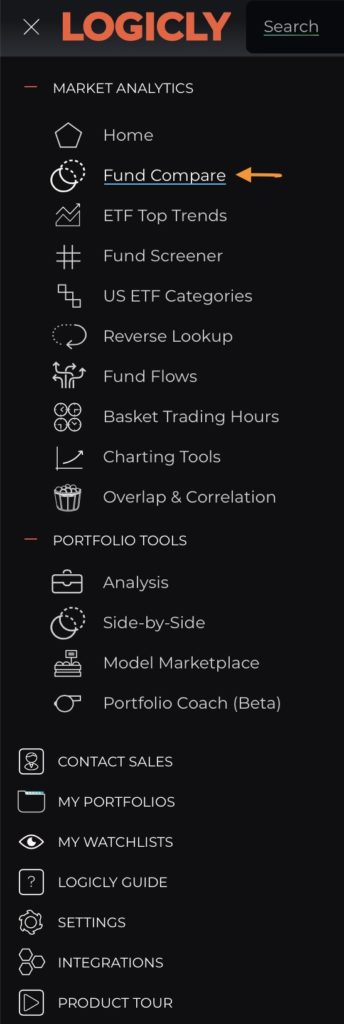
Select “Fund Compare” from the toolbar on the top left corner.
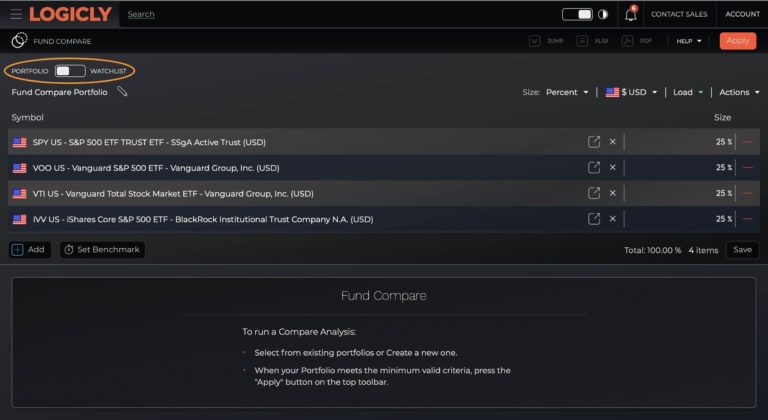
You can upload a portfolio or a watchlist and compare the underlying securities. Or you can manually input the tickers you are interested in comparing.
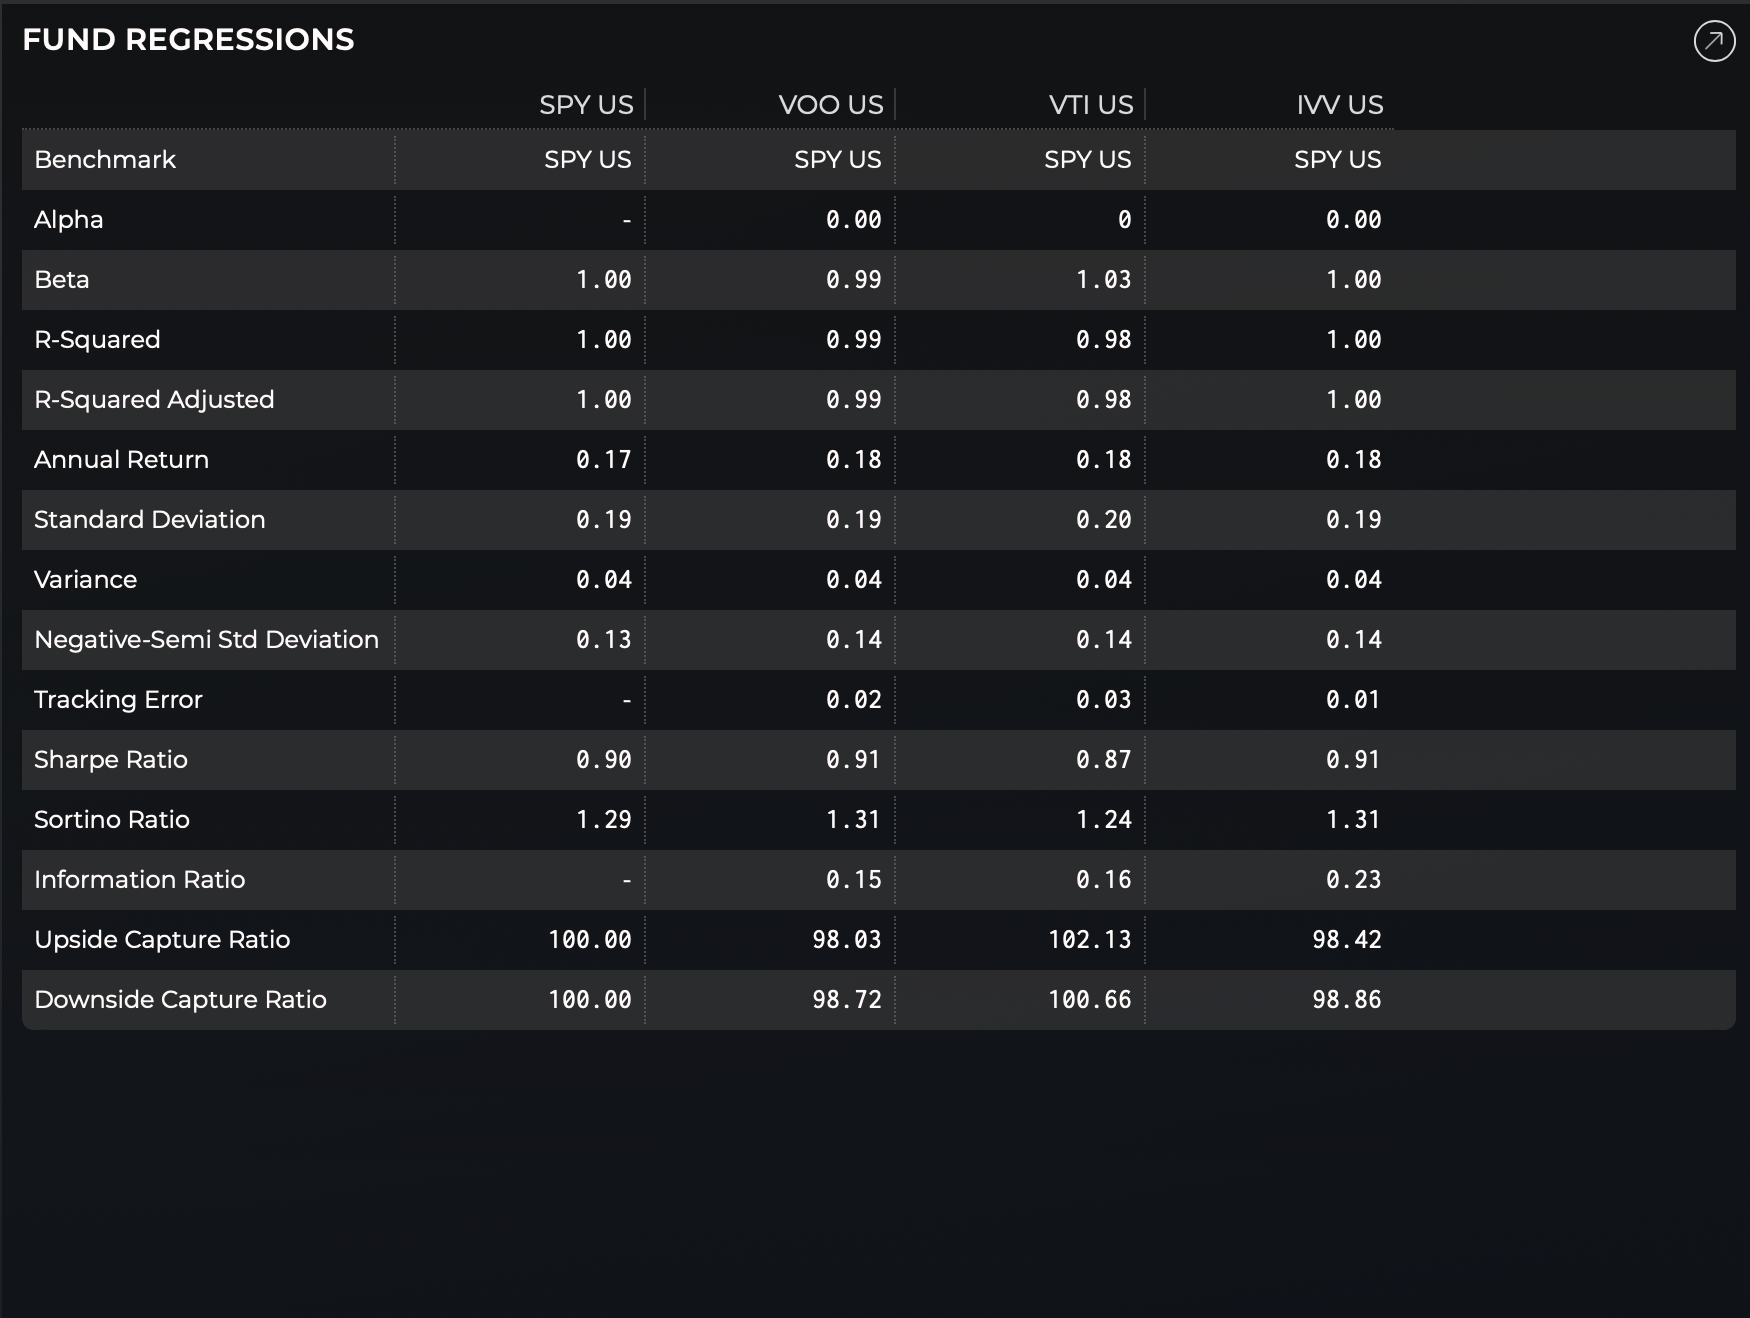
Several comparison tables are available.
Fund Regressions: alpha, beta, R-squared, standard deviation, tracking error, sharpe and sortino ratios, up and downside captures, etc…
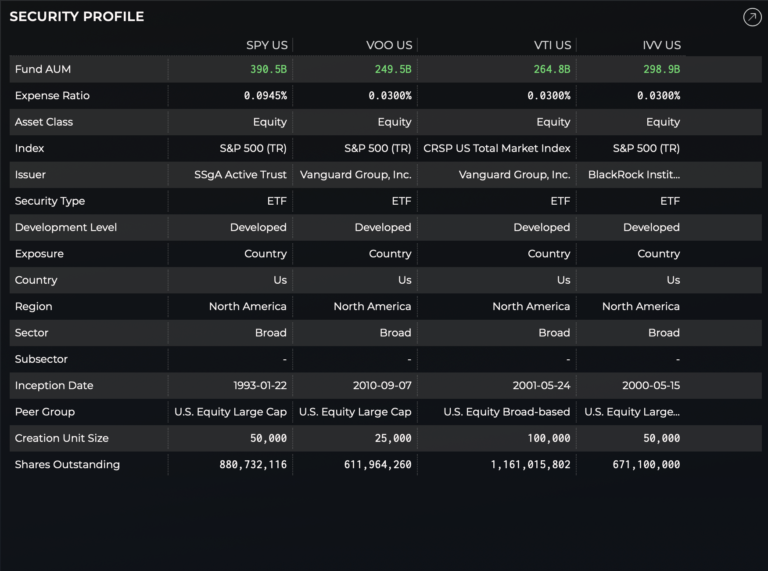
Security Profile: AUM, expense ratio, Index, Issuer, Region, Sector, etc…
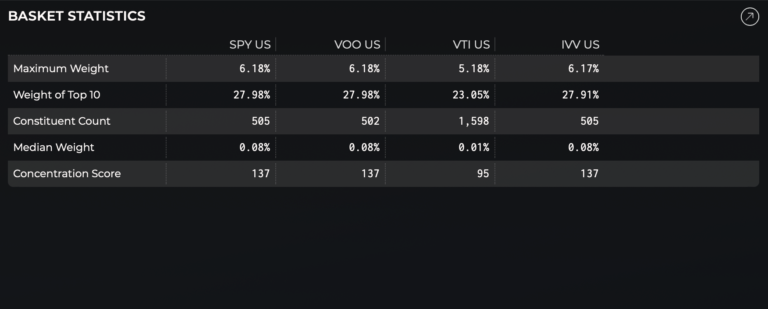
Basket Statistics: Max weight, weight of top 10, constituent count, concentration score
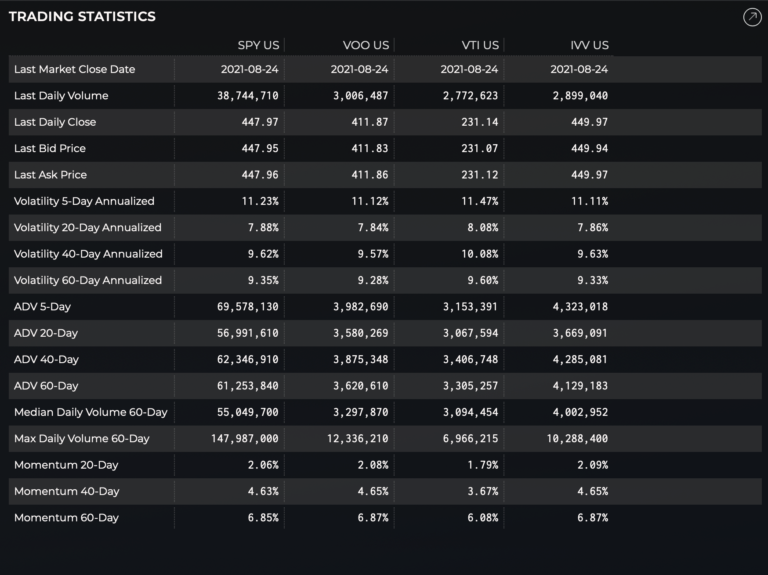
Trading Statistics: Last daily volume, last daily close price, last bid, last ask, volatility, ADV, Momentum, etc..
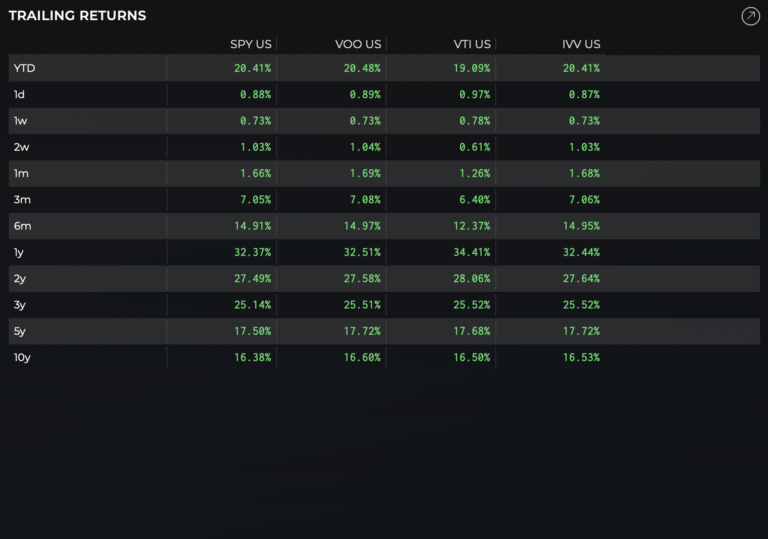
Trailing Returns:
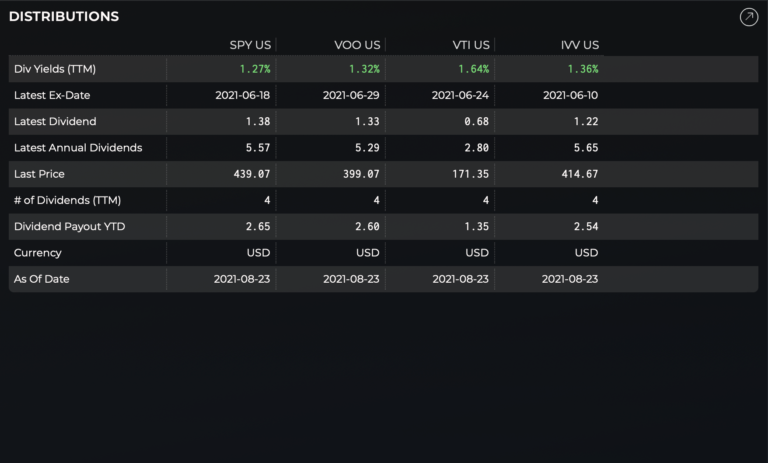
Distributions: Dividend yield (TTM), latest ex-date, latest dividend, # of dividends (TTM), etc…
Sector Weights: