By: Dounya Hamdan
dounya.hamdan@thinklogicly.com

As we step into the summer of 2023, in the wake of the July 4th celebrations, investors and advisors have a myriad of economic factors to consider. The summer months have traditionally been perceived as a quieter time for the markets, but the last decade has challenged this notion.
Data from the past ten years shows that July has consistently been a strong performer for the U.S. stock market, with the S&P 500 index rising 3.3% on average. As we navigate this summer, the question that arises is whether the markets will continue to follow this upward trend.
Energy Costs: A Boost for the Consumer?
American consumers were greeted with a pleasant surprise this Fourth of July holiday – lower gas prices. According to AAA, Americans will be hitting the road in record numbers this year, with 43.2 million motorists expected to drive 50 miles or more from their homes over the five-day holiday period.
With current national gasoline prices showing a marked decrease, down over a dollar per gallon compared to the same period last year, consumers are feeling some financial relief.
However, there’s a flip side to this coin. Despite the year-on-year decrease, gasoline prices, averaging around $3.54 a gallon, are still high when compared to the broader five-year average.
It’s worth noting that Nymex gasoline futures, a key influencer of retail fuel prices, are currently trading well below the peak levels seen last summer. This trend could act as a stabilizer, keeping pump prices from escalating too rapidly in the immediate term.
Additionally, the cost of natural gas, a key determinant of power prices, has seen a substantial decrease, almost halving over the past year.
Food Prices: A Bite Out of the Consumer’s Wallet
Despite the respite in energy costs, the cloud of food price inflation continues to loom this summer. As Americans gathered for their July 4th festivities, they would have noticed a substantial rise in their barbecue costs. The price surge, particularly prominent in the meat sector, is a product of various factors – from supply chain disruptions to labor shortages and escalating production costs.
Beef, a cornerstone of any American barbecue, was more expensive this year. Even budget-friendly options, like ground beef, came with a heftier price tag. Consumers may have had to dig deeper into their wallets to enjoy their traditional holiday cookout.
Stock Market Performance: A Summer Bloom?
The S&P 500’s average 3.3% rise over the past decade during July is a compelling statistic. This trend suggests that, despite traditional beliefs about summer market activity, July could actually be a strong period for investments.
As the glow of the Fourth of July celebrations fades, the question remains – can the market sustain this midsummer surge? A glance at past performances provides some intriguing insights.
Taking a stroll down the memory lane of the stock market, we find that in 67 of the past 95 years, the Dow Jones Industrial Average experienced a surge on the trading day preceding the 4th of July. In a similar vein, for the past four years, the S&P 500 has shown a knack for surpassing its average gain of 0.39% on the final trading day before the 4th of July, notching up an increase of at least 0.45% each time in the span from 1928 to 2022.
As we focus on this year’s performance, we see that the trend has held firm. On the eve of Independence Day 2023, the Dow Jones Industrial Average ticked up by 11 points, or 0.03%, marking its highest close at 34,418.47 since December 2, 2022. The S&P 500 and Nasdaq Composite weren’t far behind, each posting gains of 0.1% and 0.2%, respectively.
Leveraging LOGICLY for Stock Market Insights
While these historical observations don’t provide a crystal ball for future returns, they do offer a framework for informed strategies. Notably, LOGICLY‘s suite of tools provides valuable guidance.
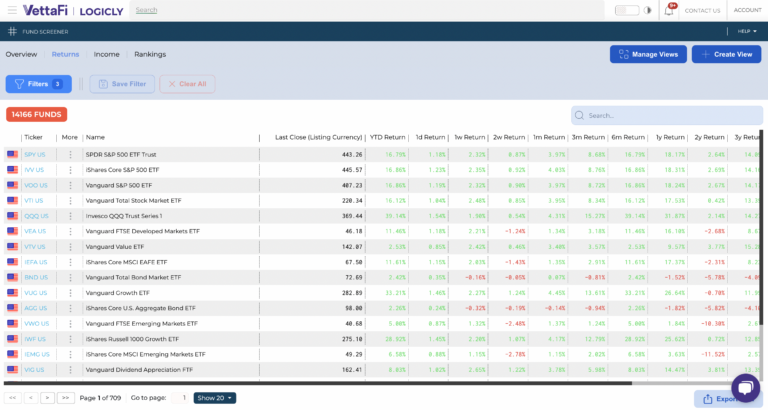
The Fund Screener tool helps track funds that have historically moved in tandem with the indices during the days leading up to Independence Day. A case in point is the SPDR S&P 500 ETF (SPY), which showed a one-week return of 2.32%.

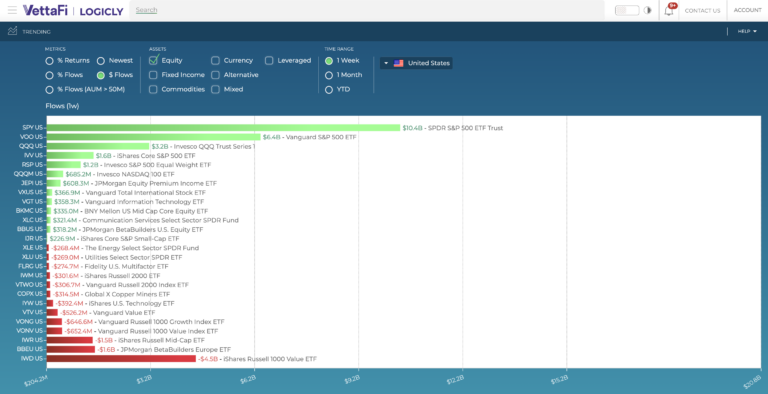
The ETF Top Trends tool is instrumental in spotting upward-moving ETFs. It’s worth noting that the S&P ETFs (SPY, IVV, and VOO) registered a significant influx of flow dollars over the past week, pointing to their sturdy performance in the run-up to July 4th.

However, the big question that now prevails – will 2023 continue to adhere to these historical trends, opening the doors for potentially remarkable gains? As the saying goes, the past may not guarantee the future, but it does often rhyme.
Enjoy reading this article? Other content you may find interesting:
- 5 Ways to Implement ESG Investing into Your Practice
- The 5 Keys to a Successful Advisor-Client Relationship
- Get Prepared for Reg BI Enforcement in 2023
- Cryptocurrency and the Rise of Custodied Assets
- The Future is Here: How Thematics is Disrupting Investing
- Women, Millennials, and Financial Planning
- How to Use One of Wall Street’s Best-Kept Secrets
To connect about media inquiries or to discuss the article, please email Dounya at: dounya.hamdan@thinklogicly.com

