
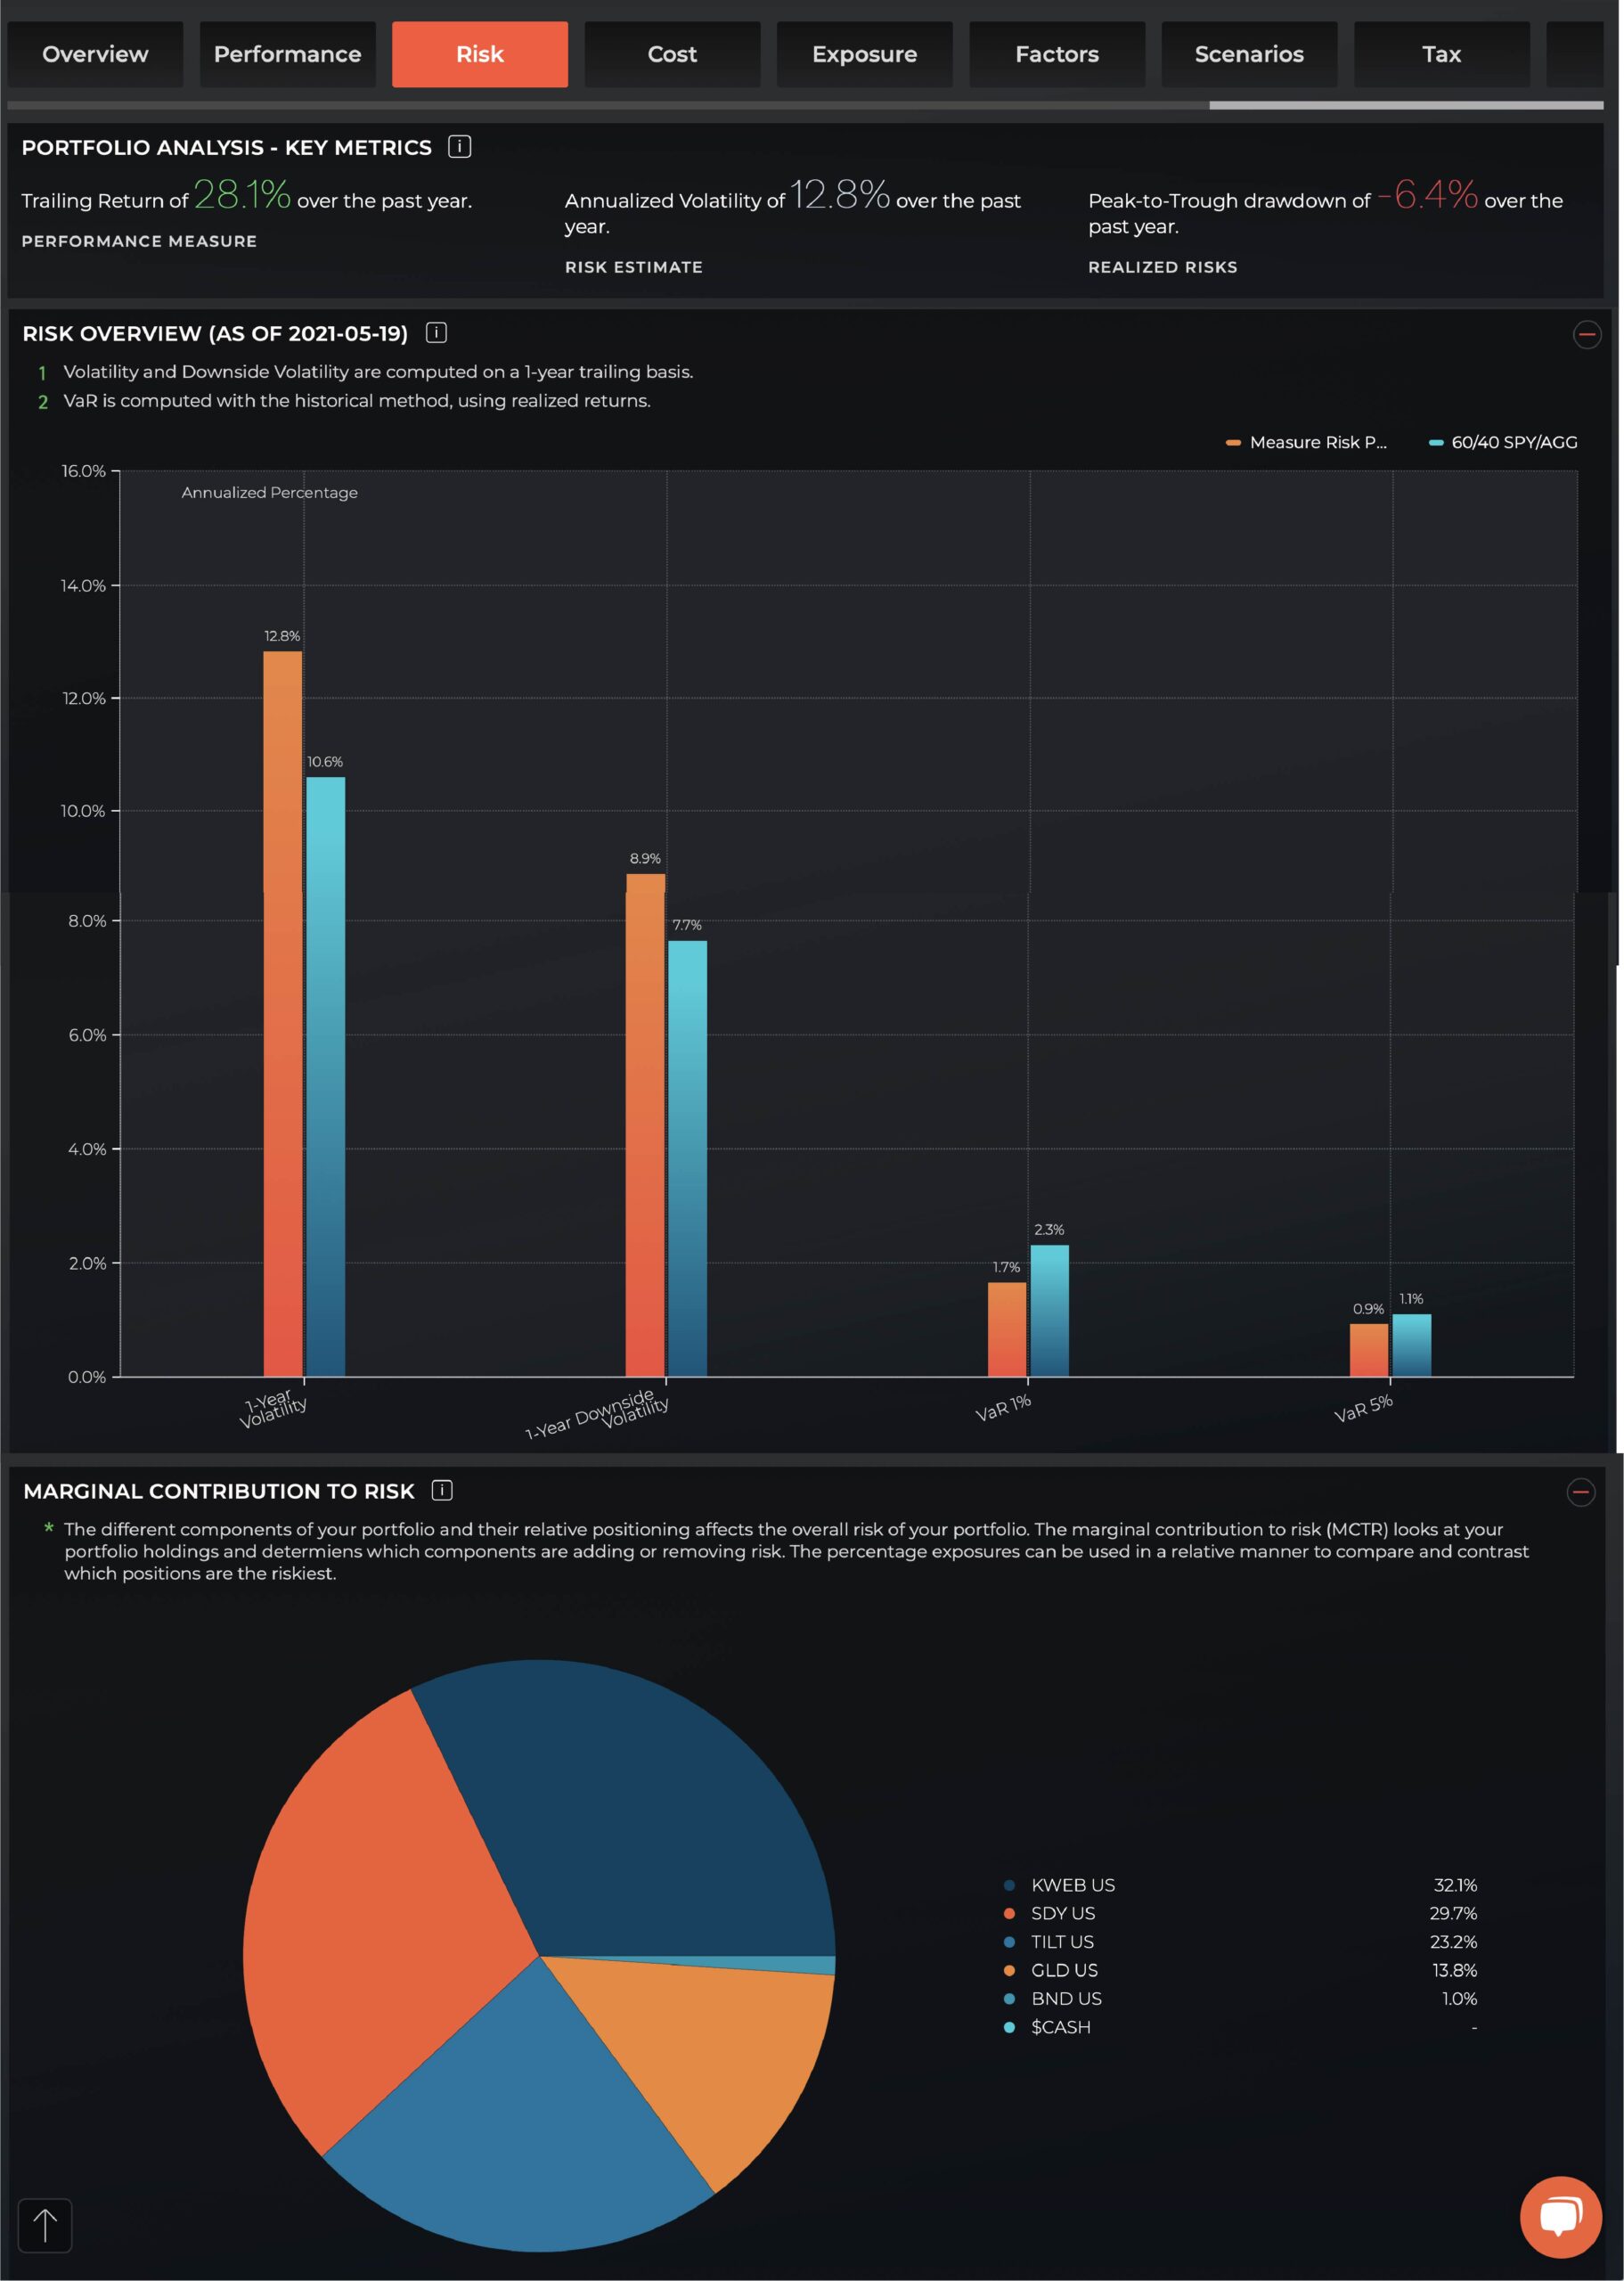
There is always a lot to say about risk and how it is defined. At Logicly, we look at risk at the portfolio level, whether that includes ETFs, mutual funds, or single stocks. Baseline statistics like 1-year historical volatility, 1-year downside volatility, Value at Risk (VaR) and marginal contribution to risk (MCTR) are all critical numbers to look at when measuring risk or comparing to other portfolios.
Historical Volatility
This is the most popular measure of risk and is represented as the standard deviation or how large an asset’s price swings around the mean or average.
Value at Risk (VaR)
This highlights the worst-case loss, historically, that happens in extreme cases 95% or 99% of the time.
Marginal Contribution to Risk (MCTR):
Do you want to know what are the main securities driving the risk in your portfolio? MCTR measures the amount of risk each individual security in your portfolio contributes to the overall risk of your portfolio. Remember risk isn’t additive. The interplay of adding different securities in your portfolio changes the overall risk based on correlations and other interplays between securities.
In the Logicly Portfolio Analysis tool, you can create, upload, or pull in a portfolio from one of our integrations with RedTail or Schwab. When you do this, within one click and a fraction of a second, you receive a deep dive on your portfolio including performance, risk, cost, exposure, factors, tax, income and ESG analytics.
Below we are showing the “Risk” tab for a sample portfolio:
In addition to the “Risk” tab, on the performance tab, you will find other important risk metrics such as “Trailing Drawdowns” and “Upside / Downside Capture Ratios”. These metrics help you understand and uncover the full risk profile of the investments in your portfolio.