
When it comes to US Sector-specific ETFs, there are four significant players. Probably the most well known is State Street, with their SPDR Select Sector line of products. These names have been around the longest and are often the most liquid, and so they tend to be the go-to sector funds. But there are several other U.S. sector-focused issuers in the game as well. Vanguard tends to take 2nd place to SPDR in terms of AUM, followed by Fidelity. In 4th place are the inexplicably expensive iShares U.S. sector products – all offering around 42bps net expense ratio. Comparing price, both Vanguard and Fidelity offer funds that offer lower expense ratios when compared to the SPDR line.
In the following analysis, we will try to get a general idea of where sector bets are being placed. August 15 marked the 45-day deadline for submissions on all Q2 2020 13F-reportable holdings published to the SEC. Although 13F data does not perfectly track a firm’s strategy, it may reveal interesting insights into asset allocation, asset strategy, and views on particular sectors, issuers, and individual funds.
You should bear a few things in mind before we dive deeper:
- ETFLogic continuously gathers thousands of 13F holdings as they are being published. Most of these reports are released on the last possible reporting date, which is normally 45 days after quarter end. For Q2 2020, that deadline was August 15, 2020.
- We look at holdings across all holder types. No filtering is being done for particular firm types (i.e., bank, advisory firm, hedge fund, etc.)
- We focus on the differences in holdings between Q1 2020 and Q2 2020
- We bucket different ETFs together using ETFLogic’s own peer grouping methodology. This groups ETFs with similar focuses together (for example by geography + market-cap segment + sector focus)
- The notional numbers throughout this article are calculated using one price for each ETF for all time periods. This gives us a general idea of the dollars in and out. These notional numbers should give you a ballpark idea of what we’re dealing with – but are far from exact.
- Similarly, in some instances we sum share positions across different ETFs. This is to obtain a general idea of share flows in each market peer group.
Notional and Share Differences Between Q1 and Q2 2020, Grouped by ETFLogic Peers
In the following table we look at all Q1 and Q2 holders of US Sector-focused funds. This table summarizes the approximate dollar and share difference in holdings reported.
| ETFLogic Peer Group | Notional Difference Q1->Q2 | Share Difference Q1->Q2 | Distinct Tickers | Distinct Holdings |
| U.S. Equity Health Care Sector | $5,267,905,754 | 38,097,048 | 9 | 3,439 |
| U.S. Equity Technology Sector | $2,412,532,493 | 25,077,006 | 8 | 3,426 |
| U.S. Equity Utilities Sector | $1,912,267,903 | 36,189,664 | 4 | 1,321 |
| U.S. Equity Telecommunications Sector | $1,591,499,362 | 27,139,020 | 4 | 827 |
| U.S. Equity Industrials Sector | $1,505,296,417 | 19,817,813 | 6 | 1,499 |
| U.S. Equity Consumer Discretionary | $858,845,082 | 10,907,548 | 5 | 1,419 |
| U.S. Equity Energy Sector | $291,272,054 | 13,093,298 | 6 | 1,407 |
| U.S. Equity Basic Materials Sector | $44,424,687 | -330,015 | 4 | 754 |
| U.S. Equity Financials Sector | -$36,416,160 | -29,435,897 | 12 | 2,210 |
| U.S. Equity Real Estate Sector | -$260,667,779 | 25,192,849 | 11 | 2,957 |
| U.S. Equity Consumer Staples | -$912,443,680 | -14,150,817 | 4 | 1,239 |
Not surprisingly with the Covid-19 backdrop, the sectors with the biggest increase in exposure were in Health Care, Technology and Utilities. Conversely, Consumer Staples, Real Estate and Financials saw large decreases in shares held.
Focus on US Equity Health Care Sector
Let’s dive a little deeper into the 9 ETFs we’ve classified in the healthcare sector peer group. The table below describes the aggregate share positions reported across all filings in both Q1 and Q2 2020. We also take the difference in notional and shares between these two quarters. As we mentioned previously, the notional amount is a rough approximation of the actual inflows into any of these ETFs.
| Ticker | Name | Q120 Shares | Q220 Shares | Q1->Q2 Shares | Q1->Q2 Notional |
| XLV | Health Care Select Sector SPDR Fund | 156,715,602 | 174,839,537 | 18,123,935 | $1,935,636,258 |
| IHI | iShares U.S. Medical Devices ETF | 7,666,960 | 12,938,998 | 5,272,038 | $1,541,122,148 |
| IBB | iShares NASDAQ Biotechnology ETF | 47,271,257 | 57,591,674 | 10,320,417 | $1,376,330,811 |
| VHT | Vanguard Health Care ETF | 17,511,407 | 18,462,722 | 951,315 | $194,876,878 |
| FHLC | Fidelity MSCI Health Care Index ETF | 9,814,062 | 12,922,634 | 3,108,572 | $164,474,545 |
| IYH | iShares U.S. Healthcare ETF | 4,174,671 | 4,491,750 | 317,079 | $72,712,556 |
| PSCH | Invesco S&P SmallCap Health Care ETF | 965,021 | 1,136,460 | 171,439 | $22,201,351 |
| IHE | iShares U.S. Pharmaceuticals ETF | 450,781 | 541,921 | 91,140 | $14,863,111 |
| IHF | iShares U.S. Healthcare Providers ETF | 3,232,393 | 2,973,506 | -258,887 | -$54,311,904 |
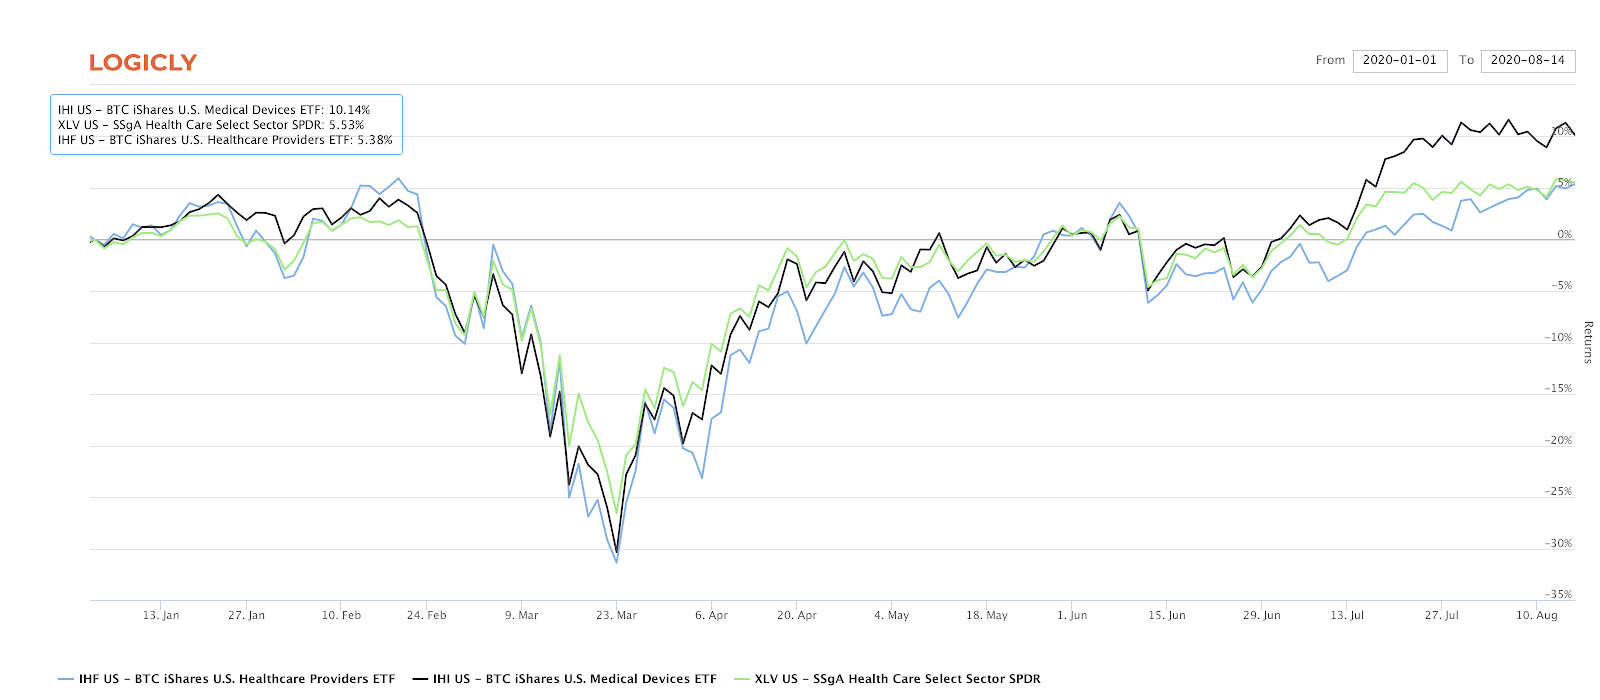
XLV from SPDR reigns supreme, with an 18+ million increase in shares held – close to $2bn of new money into the fund. In next position is IHI, the iShares US Medical Devices ETF, with a slightly more focused view on medical devices.
XLV and IHI are quite different funds. IHI has a 70% active share versus XLV, in other words only about 30% of the components in IHI are shared with XLV.
Interestingly, IHF, iShares Healthcare Providers ETF, saw a slight decrease in share held. IHF has about 80% active share versus XLV. Again, a very different positioning and take on the healthcare market than the exposure the Sector SPDR provides.
YTD (to 2020.08.14) performance has put IHI at around +10.1%, XLV at +5.3% and IHF at +5.38%.
Focus on US Equity Energy Sector
Despite the energy sector’s extreme gyrations throughout the first half of 2020, we don’t see any major dollar inflows in and out of energy sector ETFs. Nonetheless, there have been some interesting moves in certain iShares products – potentially due to model portfolio rebalances. We see an almost doubling of shares held in IYE (iShares US Energy ETF), 8x in IEZ ( iShares US Oil Equipment & Services ETF) and 2x in IEO (iShares U.S. Oil & Gas Exploration & Production ETF).
| Ticker | Name | Q120 Shares | Q220 Shares | Q1->Q2 Shares | Q1->Q2 Notional |
| XLE | Energy Select Sector SPDR Fund | 137,428,461 | 141,520,191 | 4,091,730 | $156,263,169 |
| IYE | iShares U.S. Energy ETF | 5,326,781 | 9,675,037 | 4,348,256 | $88,660,940 |
| IEZ | iShares U.S. Oil Equipment & Services ETF | 1,024,762 | 8,671,006 | 7,646,244 | $77,074,140 |
| IEO | iShares U.S. Oil & Gas Exploration & Production ETF | 1,207,323 | 2,363,889 | 1,156,566 | $39,970,921 |
| FENY | Fidelity MSCI Energy Index ETF | 10,989,075 | 7,532,413 | -3,456,662 | -$34,981,419 |
| VDE | Vanguard Energy ETF | 17,891,138 | 17,198,302 | -692,836 | -$35,715,696 |
We can drill down further on these iShares products held at individual firms. For example, we do note that Morgan Stanley holdings in IEZ jump from 189K shares in Q1 to 2.6 million shares in Q2. Could this be advisor model portfolio rotation or an outsized bet by some hedge funds. Or maybe a delta-one position on the create-to-lend desk?
The answer lies a bit further down. We note a handful of new holders in IEZ – firms that have large positions in Q2 but had no positions in Q1. Envestnet Asset Management, a turnkey asset management provider or TAMP, shows up with an IEZ position for the first time in Q2 2020 – at around 529k shares held. In fact a handful of firms appear to match this pattern.
Largest Owners of IEZ iShares U.S. Oil Equipment & Services ETF in Q2 2020 when there were no reported holdings in Q1 2020.
| Company | Q2 2020 Shares Held |
| ENVESTNET ASSET MANAGEMENT INC | 592,530 |
| MINICHMACGREGOR WEALTH MANAGEMENT, LLC | 403,926 |
| RAYMOND JAMES & ASSOCIATES | 363,053 |
| AMERIPRISE FINANCIAL INC | 355,435 |
| STIFEL FINANCIAL CORP | 174,630 |
| AE WEALTH MANAGEMENT LLC | 114,628 |
| TEAMWORK FINANCIAL ADVISORS, LLC | 110,148 |
| VICUS CAPITAL | 94,267 |
| HAP TRADING, LLC | 82,982 |
| BEAUMONT FINANCIAL PARTNERS, LLC | 82,129 |
| RAYMOND JAMES FINANCIAL SERVICES ADVISORS, INC. | 69,887 |
| WELL DONE, LLC | 66,485 |
| CARROLL FINANCIAL ASSOCIATES, INC. | 44,566 |
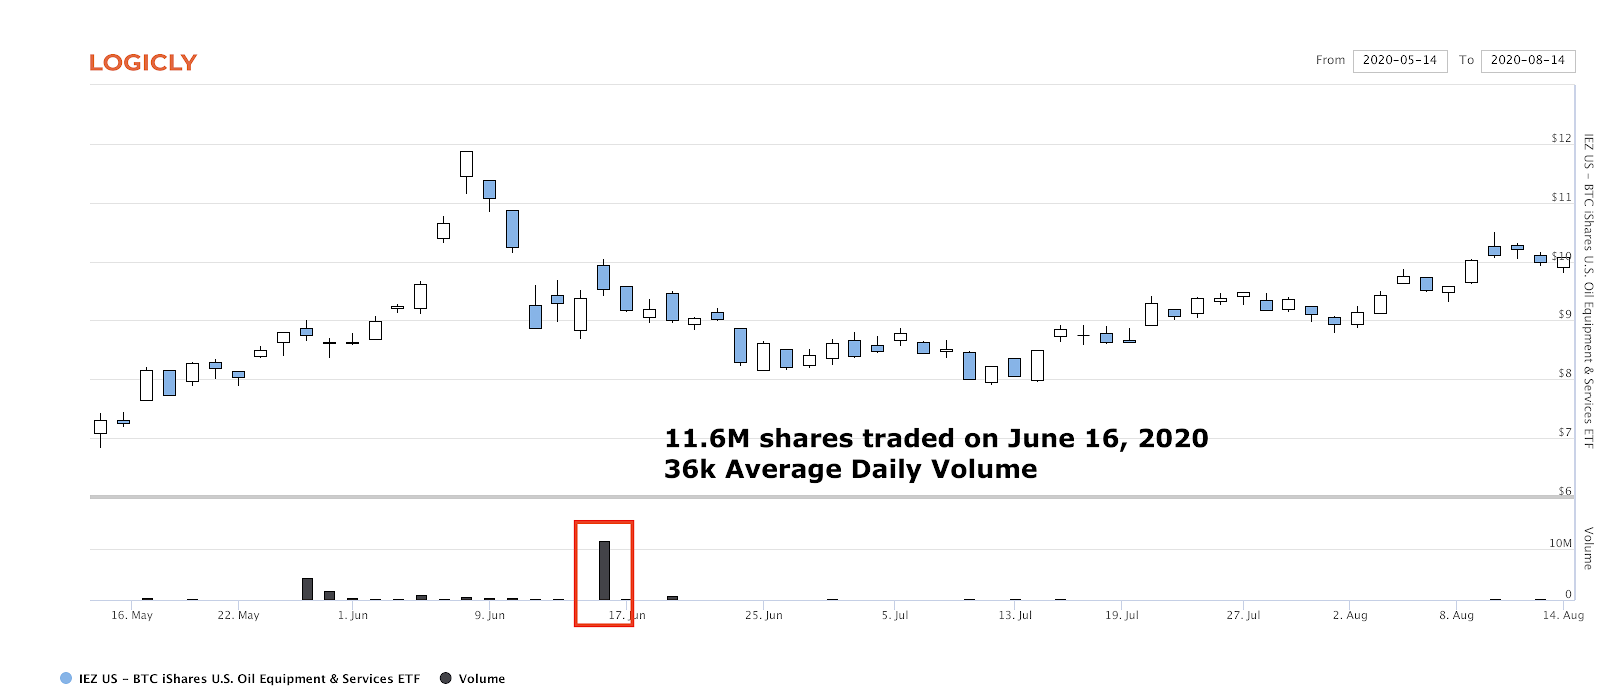
Digging a little deeper into IEZ historical trading, we do note an outsized volume day on June 16, 2020 of almost 12 million shares traded, for a fund that has a 20-day average daily volume around 37,000 shares currently. It is safe to say that a model portfolio rotation triggered a fairly large buy into this name. This would also explain why many of the new holders of IEZ are advisor-focused firms.
Focus on US Equity Real Estate Sector
The aggregate Real Estate peer group saw slight outflows across the 11 ETFs in this bucket. However, looking under the hood at individual names is quite revealing. One of the biggest winners is XLRE with close to $1.5bn in, balancing out ETFs with a large drop in holdings such as VNQ, the Vanguard Real Estate ETF, with $1bn out and SCHH, the Schwab US REIT ETF, with $621m out.
| Ticker | Name | Q120 Shares | Q220 Shares | Q1->Q2 Shares | Q1->Q2 Notional |
| XLRE | Real Estate Select Sector SPDR Fund | 66,679,107 | 109,711,494 | 43,032,387 | $1,543,141,398 |
| FREL | Fidelity MSCI Real Estate Index ETF | 12,270,031 | 30,921,964 | 18,651,933 | $450,817,221 |
| SRVR | Pacer Benchmark Data & Infrastructure Real Estate SCTR ETF | 6,161,806 | 10,167,266 | 4,005,460 | $145,478,307 |
| BBRE | JPMorgan BetaBuilders MSCI U.S. REIT ETF | 11,347,264 | 11,292,415 | -54,849 | -$4,075,067 |
| REZ | iShares Residential Real Estate ETF | 2,139,513 | 2,030,335 | -109,178 | -$6,746,109 |
| FRI | First Trust S&P REIT Index Fund | 2,853,749 | 2,062,630 | -791,119 | -$17,203,674 |
| USRT | iShares Core U.S. REIT ETF | 18,379,430 | 16,333,242 | -2,046,188 | -$92,692,316 |
| RWR | SPDR Dow Jones REIT ETF | 14,783,620 | 11,824,730 | -2,958,890 | -$238,693,656 |
| IYR | iShares U.S. Real Estate ETF | 41,249,443 | 36,188,865 | -5,060,578 | -$413,348,011 |
| SCHH | Schwab U.S. REIT ETF | 99,837,676 | 82,750,704 | -17,086,972 | -$621,965,781 |
| VNQ | Vanguard Real Estate ETF | 214,958,104 | 202,568,947 | -12,389,157 | -$1,005,380,091 |
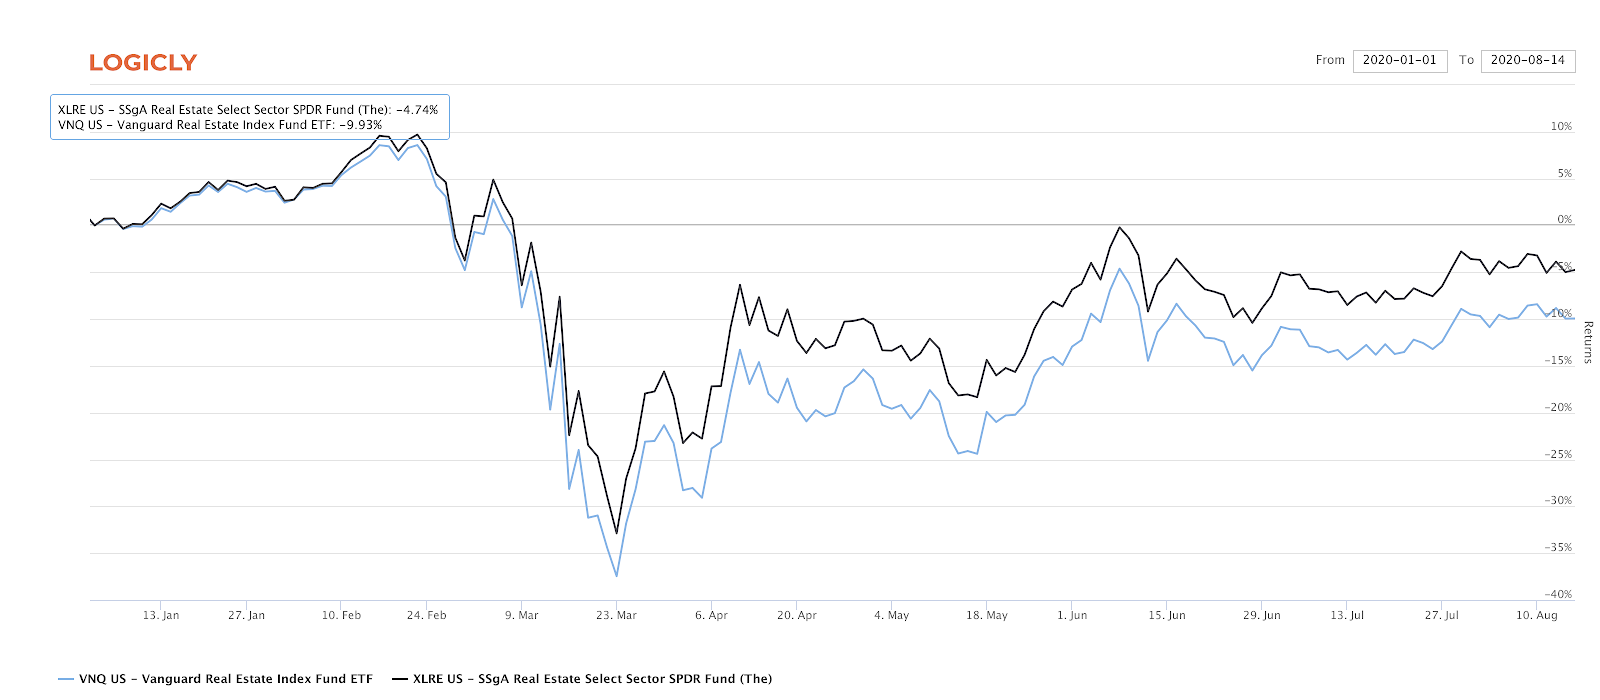
If a VNQ to XLRE switch trade was for tax loss harvesting reasons, it seems to have been good positioning. They are about 99% correlated but VNQ’s active share with respect to XLRE is about 41%. Furthermore the trade seems to have paid off since the March lows, with XLRE out-performing slightly.
Conclusion
Because there are so many ETFs out there that are highly correlated with each other but do not track the same index, ETFs are ideal candidates for harvesting tax credits without deviating too far from asset allocation benchmarks. Using ETFLogic’s Tax Loss Prospecting tool, you can easily bring together ETFLogic peer groups, price correlation and basket analytics stats like percent overlap and active share to find potential ETF replacement trades and ideas.
13F analysis remains an interesting way to see which ETFs are being used and how firms invest. We hope that recent regulatory proposals that raise the minimum AUM thresholds for 13F reporting do not take hold, as this reduces transparency and provides us with less data to analyze.
If you are interested in a free trial of our Logicly platform to try out the Tax Loss Prospecting tool, you can request your free trial code here.