
Our continuous innovation of the LOGICLY platform makes it easier and simpler for clients like you to work every day. That’s how we empower and inspire confident outcomes.
Today, we’re sharing exciting news about our latest release!
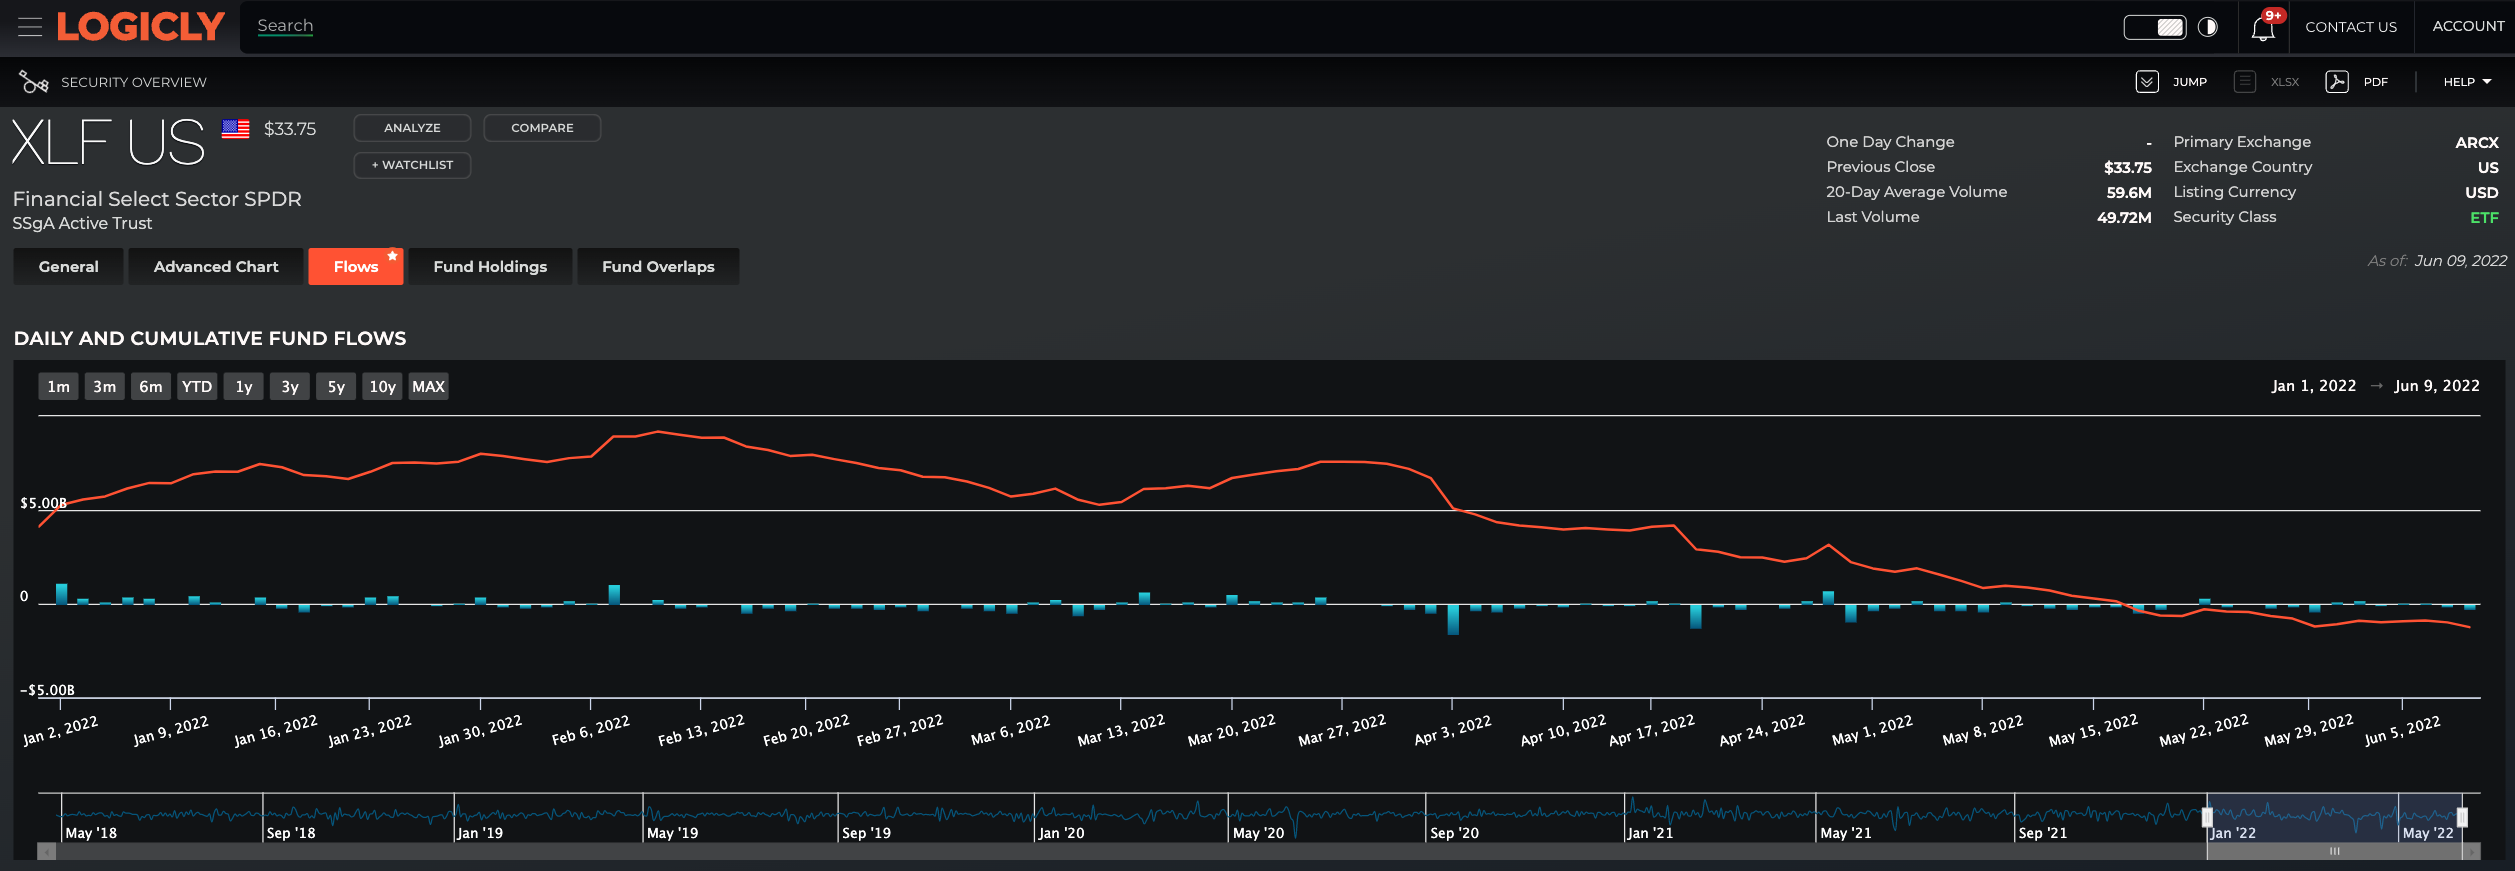
Research and analysis are the starting points for investment selection and decision-making. Supporting this, LOGICLY subscribers and users can dive into fund flows for any ETF in the Security Overview, using the new “Flows” tab.
This is a key update that enables users to:
- View daily and cumulative flows across any time frame
- Set custom date ranges to examine flows during specific market events
- Preset date ranges: 1m, 3m, 6m, YTD, 1y, 3y, 5y, 10y, MAX (inception)
- Use chart with sliders at bottom to zero in on specific time periods of interest
- Drill down into flows to see cause and effect of market performance on a specific ETF
- Compare to flows for other ETFs to see correlation or lack thereof (for example, XLF vs SCHR)
Click here to see the new Flows release in LOGICLY using XLF (the Financial Sector ETF).
This release serves the financial advisory community. asset managers, portfolio managers, RIAs, Broker Dealers, and financial institutions. The below image shows an example of the Security Overview-Flows view that subscribers and users will see when using LOGICLY.
Read about LOGICLY solutions for advisors including:
- Using the Tax App to Increase Tax Alpha & Efficiency
- How to Win More Business with the Efficient Frontier
- Why You Should Analyze Fund Regressions BEFORE Choosing ETFs or Funds
- How LOGICLY Aids Advisors in Navigating Reg BI Requirements
Contact us to learn more about LOGICLY. Subscribe to our YouTube channel to see useful videos: LOGICLY on YouTube.