
 -By Lindsey Tewell, Head of Sales lindsey.tewell@thinklogicly.com
Market Volatility is back, back again.
From November 2012 through March 2020, stock market volatility as measured by 3-year standard deviation of the S&P 500, trended below its long-term average for a span of 89 months. This is the second longest in history. The first being for 96 months between June 1947 and May 1955. So for most of us, this recent spike in stock market volatility is unparalleled.
The market doesn’t like unpredictability and today’s backdrop is muddled with unanswered questions related to inflation and the resolution of Russia’s war on Ukraine, for example.
So as a financial advisor, you must ask yourself important, tough questions:
“How am I minimizing the impact of volatility on my clients’ portfolios?”
“Am I prepared for a long, rough stretch for the global markets?”
“How do I calm the nerves of rattled clients?
In a recent article titled, “Hello Risk My Old Friend”, Morningstar defined different measures of risk. Standard deviation was noted as a measure of risk that falls short since it treats upside and downside risk the same. Another key risk metric noted is similar to the Sortino ratio. This risk measure does not ignore the upside risk all together but places a greater emphasis on the downside risk.
Financial advisors who use LOGICLY to research, build, and manage portfolios tell us that they consider the following additional risk measures when reviewing client portfolios.
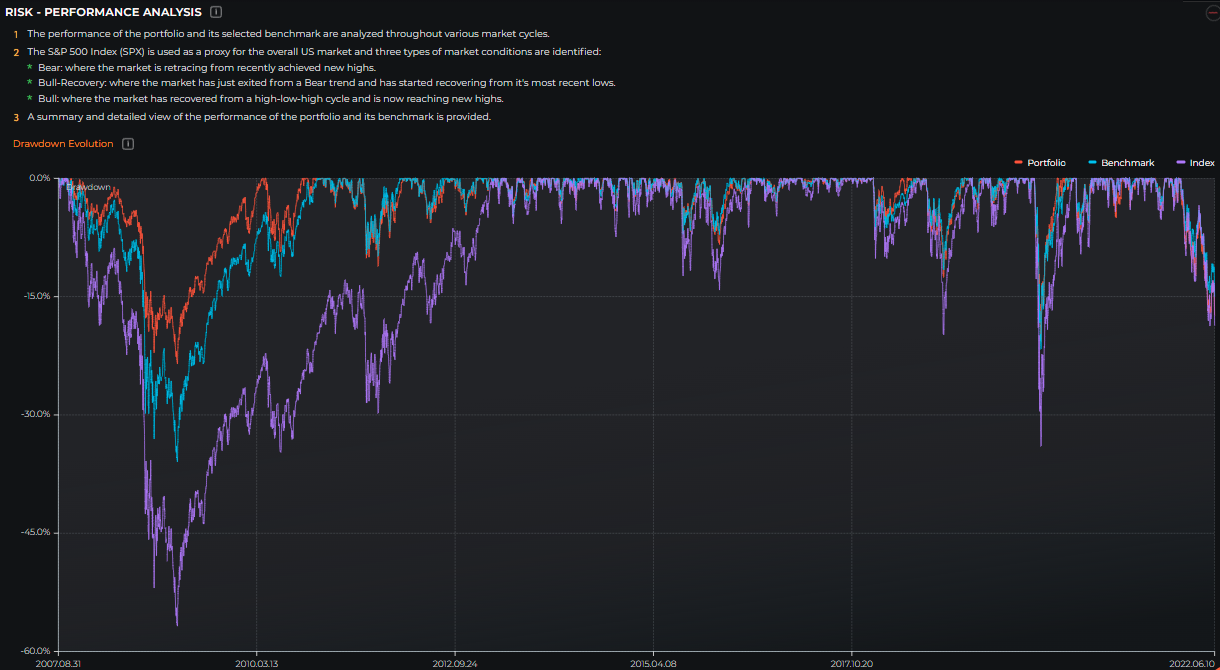
Drawdown Evolution:
Analyzing how a portfolio performed during historical market drawdowns is one of the most straightforward and intuitive ways for evaluating risk. Adding a benchmark or other portfolio as a comparison fine-tunes drawdowns to cushion the market’s roller coaster ride for your clients and build optimal portfolios.
LOGICLY’s Portfolio Analysis tools makes this process easy.
We use the S&P 500 Index (SPX) as a proxy for the broad US market. Then, we identify different market scenarios:
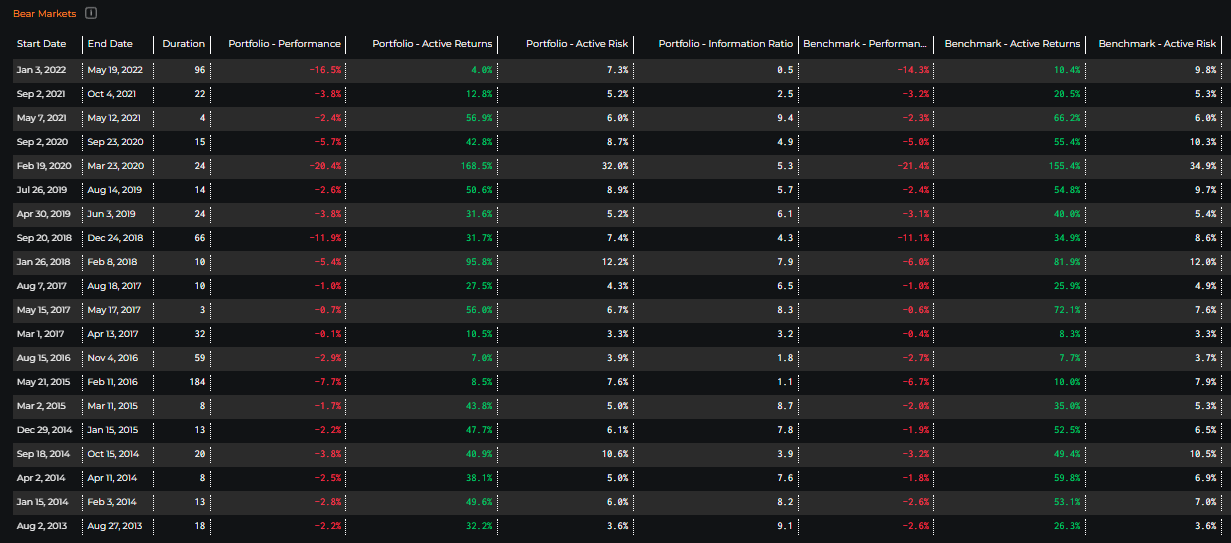
- Bear scenario where the market is retracing from recently achieved new highs.
- Bull-Recovery scenario where the market just exited from a Bear trend and has started recovering from the most recent lows.
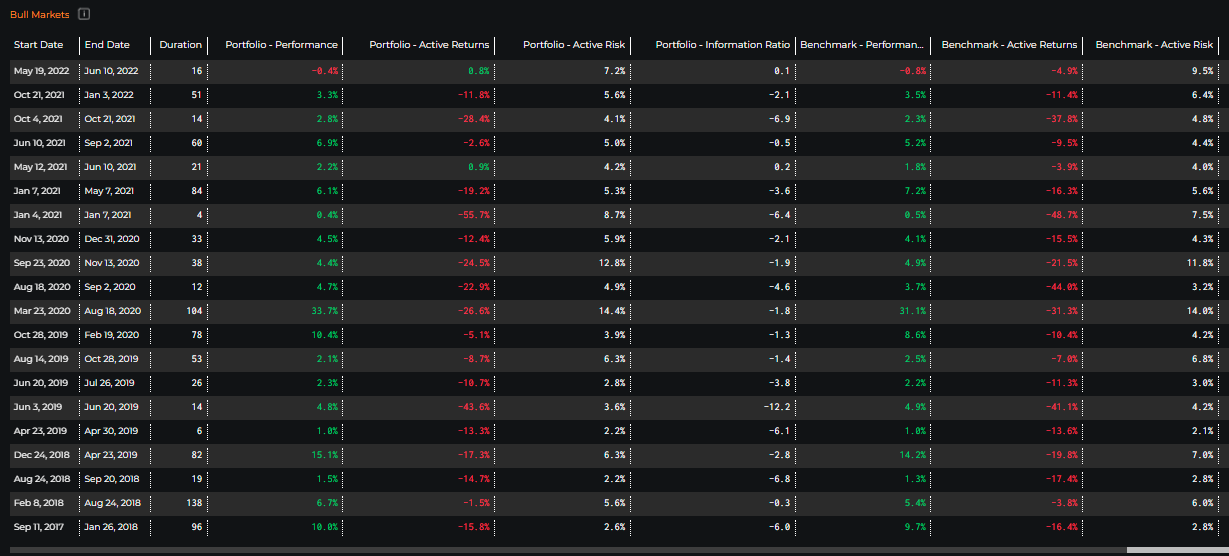
- Bull scenario where the market has recovered from a high-low-high cycle and is now reaching new highs.
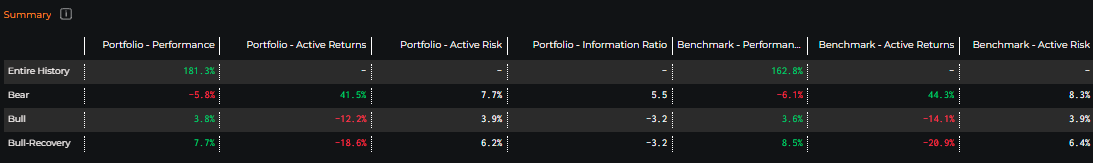
For each type of market scenario, we provide a summary and detailed view of the performance of the portfolio and any chosen benchmarks.
Marginal Contribution To Risk (MCTR):
Using a different “risk lens” we can identify historically risky positions in your portfolio. In other words, you can drill down to individual positions in your portfolio that may have contributed to the overall risk of your portfolio in an outsized manner in the past. Using the Marginal Contribution to Risk (MCTR) calculations, you can measure the amount of risk individual securities contribute to the overall risk of the portfolio. Risk is not additive because of correlation or the interplay of different securities in your portfolio.
With the “MCTR – Time Series Evolution” chart, you have a historical visual of how different securities were contributing to the incremental risk of your portfolio, over time.
Looking at this risk history is important. We know that secular shifts happen in sectors or thematic spaces all the time. For example, the energy sector can move based on oil shocks or other geopolitical events, or new or proposed legislation can make or break entire swaths of thematics. Being able to see these shifts in a historical manner through the MCTR risk lens is just another way to make better portfolios for your clients.

When utilizing risk measurement tools, such as Drawdown Evolution and MCTR, financial advisors are well equipped in identifying riskier assets, getting ahead of a ‘bad market’ and prioritizing the assessment of long term investments to prevent market volatility from affecting your clients’ portfolios.
Read about LOGICLY solutions for advisors including:
- Using the Tax App to Increase Tax Alpha & Efficiency
- How to Win More Business with the Efficient Frontier
- Why You Should Analyze Fund Regressions BEFORE Choosing ETFs or Funds
- How LOGICLY Aids Advisors in Navigating Reg BI Requirements
To connect about media inquiries or to discuss the article, please email me at: lindsey.tewell@thinklogicly.com.