-By Colin Gloeckler, CFA, Chief Strategist  colin.gloeckler@thinklogicly.com
Real yields are the difference between nominal yields and projected inflation. A positive reading means that investors are expected to accrue purchasing power over the life of their investment. During the pandemic, key reference yields dipped below zero percent in real terms. This reaction from the market, driven by massive stimulus packages and heavy Fed interventionism, has now completely reversed. A recent article in Financial Magazine discussed the possible impact to financial markets from interest rate changes – we expand on the topic below. For financial advisors, this creates an opportunity to review each client’s Investment Policy Statement (IPS) to (1), ensure clients are aware of the changing environment, (2), document any changes, (3) act to implement a changing strategy, if/where appropriate.
What happened (reversing a two-year trend)
On April 29th, for the first time in over two years, real yields ticked back into positive territory. With inflation on the rise and, maybe even more important, the “topic of inflation” rapidly becoming top of mind concern for a lot of investors and economists, the indication that bonds can be back in the mix as viable source of inflation-adjusted yield is likely to trigger multiple side effects.
By definition, the real yield concept takes out the estimated inflation from the nominal yield stated for a given security. To illustrate this difference between real and nominal yields, let’s go back to the essence of investing. When an investor decides to hold a security (Bond, Stock, etc.), they expect it to deliver some yield – paid in exchange for the risk taken when tying up money in the security. That said, for the invested money to actually participate in growing the investor’s wealth, the yield achieved over the investment period must to be higher than the inflation measured over the given period. If not, then the investor has lost money “in real terms”. This also highlights why holding cash, while risk-free, is not particularly helpful to investors in real terms, as they actually lose purchasing power.
Consider the following example of a bond in an investor’s portfolio:
Positive Real Yield Scenario Negative Real Yield Scenario
Nominal Rate = 3.0% Nominal Rate = 3.0%
Inflation = 2.5% Inflation Rate = 4.0%
Real Yield = 0.5% Real Yield = (1.0%)
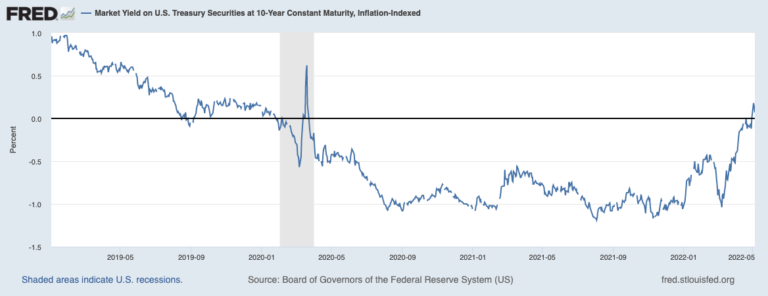
In March 2020, acknowledging that the world was entering a phase of unprecedented pandemic (and true to its mission to support the broader economy), the Federal Reserve took swift action. Expecting major disruptions to the global supply-chain, FOMC board members brought Federal Funds Target Rates to zero, and initiated a new round of Quantitative Easing (”QE”). Jerome Powell, the Fed’s chair pledged at the time to do “whatever it takes” and the news of massive buying programs was welcomed by financial markets.
Anticipating the Fed’s response to growing concerns about the impact of a crisis that no one could really anticipate, evaluate, or control, the 10Y Treasury Note yield had already decreased by ~100bps, leading bond investors to lose money in real terms. Looking for returns, portfolio managers reallocated to suddenly-appealing equity markets.
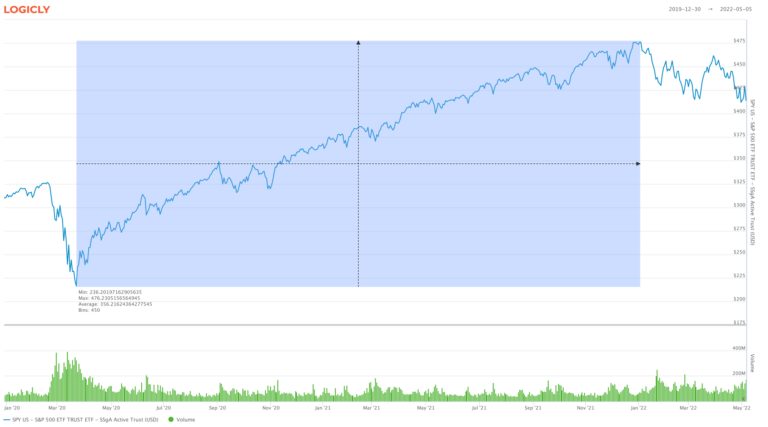
Classic finance theories teach that the value of stock is the discounted (or present) value of its future cash flows. Mechanically, this concept pushes valuations higher when the interest rate used to discount future cash flows is close to zero. And, for more than two years, the magic happened! The most powerful weapon in the Fed’s toolkit worked to perfection. Using SPY, the S&P500 ETF, as a proxy for the US large cap equity market, the adjusted price soared from around $250/share to an all-time high of almost $480/share.
What’s happening now
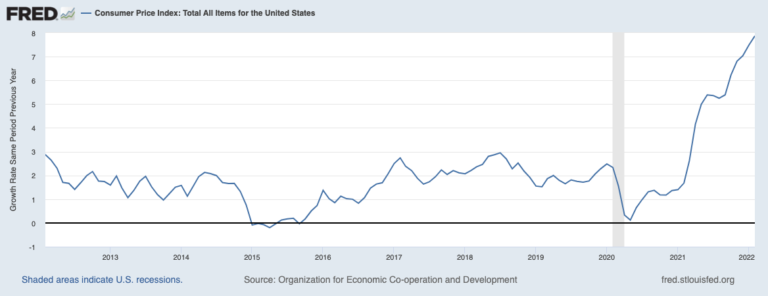
Fast forward two years and the U.S. economy is facing a different kind of challenge. Inflation, as measured with the Fed’s-favorite Consumer Price Index (CPI), keeps ticking higher, month after month. More worrisome, the pace of inflation, measured through CPI change YoY, is now firmly in the vicinity of readings that have not been seen since the early 1980s, reaching an estimate of 8.5% in March 2022. In the 1980s, the United States was deep in a recession and then-Fed chair Paul Volcker was trying everything to come back from off-the-charts inflation.
Unlike responding to a pandemic, cooling down an economy that appears to be slightly over-heating is a page in the Fed’s playbook that has been used before. By raising key interest rates, the Federal Reserve inflates the cost of money. This effectively sets in motion a series of readjustments that in theory lead to a slowing down of the broader economy. When borrowing becomes more expensive (for businesses and individuals), the expected implication is for investments to retract, leading to fewer new jobs and a gradual tampering of consumer spending.
In short, the Fed is currently navigating a significant adjustment of its monetary policy. Its Asset Purchase programs were running at full speed just a few months ago (the beginning of the tapering was announced in November 2021) and Fed governors were committed to enforcing the official accommodative language. Not even six months later, inflationary pressures are accelerating the agenda for simultaneously raising target rates and unwinding a significant portion of the Fed’s massive balance sheet. On May 4th, following a first quarter point hike in March, the Fed lifted its benchmark interest rate by 50bps, and emphasized that there’s more to come. The move is the largest increase since 2000 and it underscores the urgency to act to keep inflation at reasonable levels.
What’s next?
The name of the game is to avoid a recession at all costs. Coming from a phase of heavy stimulus and jumping into talks of stagflation – with stagnant or declining economic growth coupled with growing inflation – is the worst possible scenario. The Fed’s expertise with walking an economic tightrope will be on full display when responding to the general consensus that rates need to increase, but in a way that allows the economy to keep on expanding.
Adding to this already complex equation, the global geopolitical context is a significant source of uncertainty. Examples of ongoing disruptions to the global equilibrium of supply and demand abound. An obvious example, the war in Ukraine is already visibly disturbing the supply of direct or indirect commodities (fertilizer, wheat, etc.) and is expected to have a long-term impact on the energy market.
As a result, the market volatility observed recently is unlikely to dwindle in the short term, putting investors in the toughest spot. Navigating uncertain macroeconomic times is always a challenge. At LOGICLY, we firmly believe that the best response is a periodic and rigorous review of a portfolio’s allocations and exposures. Such a process should encompass a detailed review of both the Strategic Asset Allocation (what the portfolio is exposed to), as well as the Tactical Asset Allocation (how this exposure is implemented). In practice, this means going beyond stated investment objectives or generic classifications for the holdings. For instance, digging through ETF and mutual fund holdings will provide a far more accurate picture of the drivers of both risks and returns for a portfolio.
To take a concrete example, we previously highlighted that not all stocks will be treated equal in context of tightening macro conditions. The ultra-low interest rates set as a response to the pandemic have helped accelerate the predominance of Tech stocks in most market-cap weighted U.S. Equity indices. For example, the top six (6) holdings for SPY are in the Tech sector and have a combined weight of ~22%.
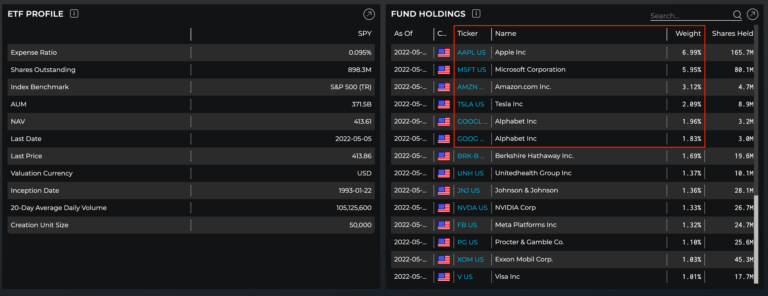
These Growth investments – for which the company’s capacity to generate positive cash flows in the future is the main driver of current value – have achieved lofty valuations. After two years of riding the stimulus wave, prices are coming under significant pressure with investors having viable alternatives to redeploy capital and look for yield in potentially less risky corners of the market.
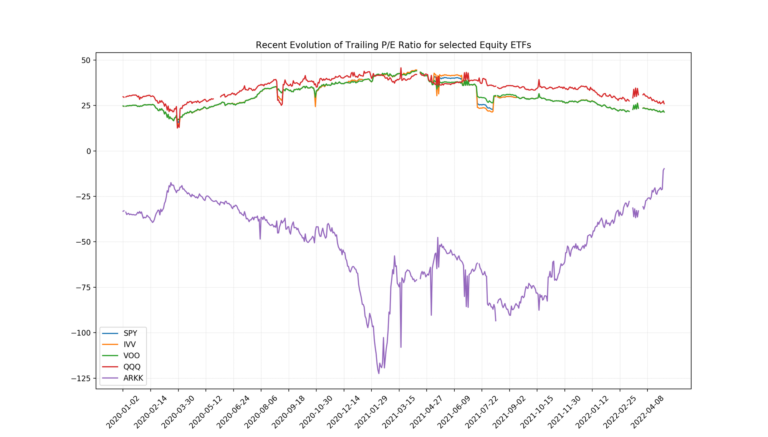
Using LOGICLY’s Alternative Data Set, EFF – ETF Fundamental Financial Statement Features, we can track the evolution of numerous metrics commonly used for valuation analysis. For this article, we will single out the Trailing P/E Ratio as we believe it provides the best picture of the multiple at which the market prices stocks. Additionally, we look at it from an ETF perspective. Instead of tracking individual holdings in the basket, we view ETFs as nearly perfect proxies for thematic investments, as well as market-efficient vehicles.
We ran the analysis for broad equity funds (SPY, IVV and VOO) as well as more tech-focused funds – making a distinction between funds targeting more established businesses (QQQ) versus the up-and-comers (ARKK). We observe a clear pattern of ongoing downward readjustment of previously record-high prices. It is interesting to point out that QQQ is still trading at a higher multiple, but since the Fed started raising rates, the spread with broad equity funds has narrowed quickly. With respect to ARKK, since most holdings are still delivering negative earnings per shares, the P/E Ratio increasing is due to a significant downward pressure on the price.
For asset managers and financial advisors, this is a clarion call to review thoroughly what clients are holding in their portfolios. We’ve seen that being invested in an S&P500 fund actually exposes them to a significant growth position, which might not be suitable for all types of investors in the current environment. In the face of fundamental shifts happening in the market right now, it’s as important as ever to:
- Know what you own
- Understand embedded risks
- Capture what you believe are the right exposures
- Assess the suitability of investments
- Pay the right price
- Stay invested
To connect about media inquiries or to discuss the article, please email me at: colin.gloeckler@thinklogicly.com.

